Feature Wiki
Tabs
Aggregation Reporting Panels
Page Overview
[Hide]1 Initial Problem
This subproject tackles problems laid out in the article presentation of competence results.
2 Conceptual Summary
- Provides summary information accross several competences
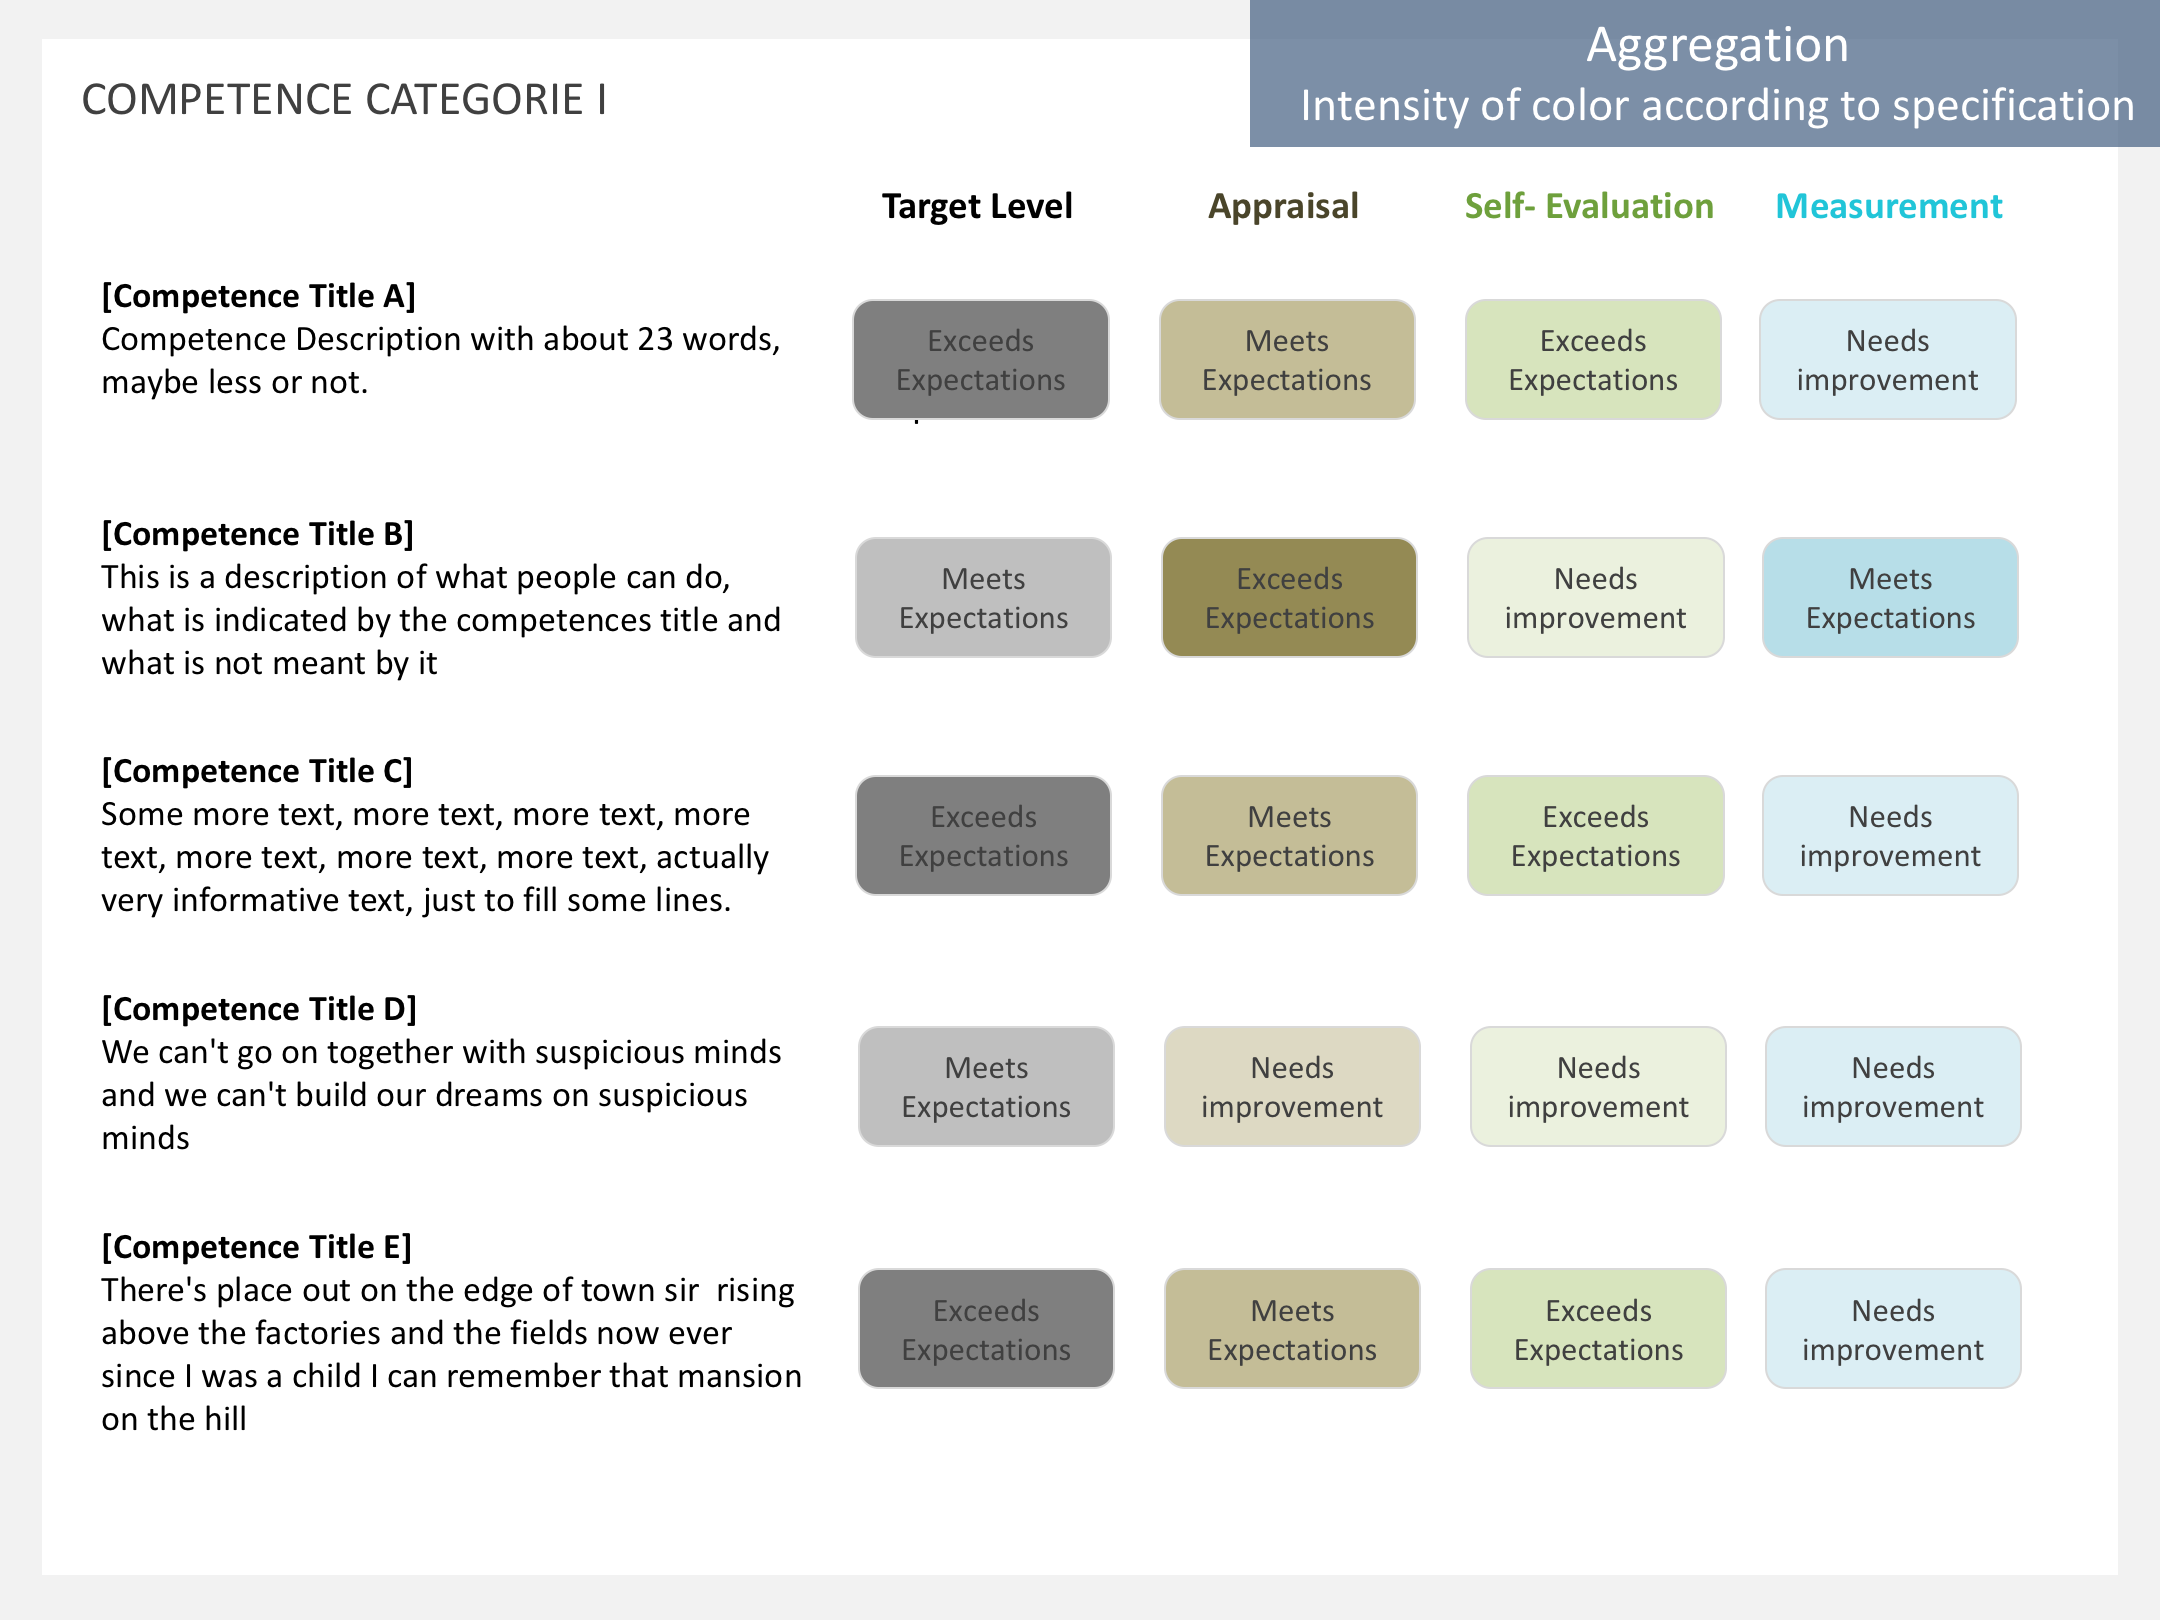
- We oppose any traffic-light coloring
- We would like to have the possibility to display an easy to understand / compare key figure of competence development.
- We are aware of the methodological pitfalls of this endeavor: We oppose computing averages across types of formations , because (self-evaluation + measurement from a test) / 2 = Nonsense
- We consider aggregating across multiple competence records of the SAME formation type. Before computing averages of competence results from the same type of formation we have to answer the following questions in a methodologically sound fashion:
- Competence records from tests are hard to average across tests unless we can weight the records for test difficulty using the facility index (or something similar) of said tests. How should the weighting be carried out exactly?
- Length is an established predictor of reliability. Competence records from tests are hard to average across tests unless we can weight the records for test reliability. If you do not do this we might compute an average of a competence record based on 3 questions and one competence record based on 40 questions. How do we weight for reliability?
- From tests with multiple test runs it has to be decided which test runs to include. Candidates are: all, an average of all, the last, the best. According to what speific set of rules will test runs be included into averaging?
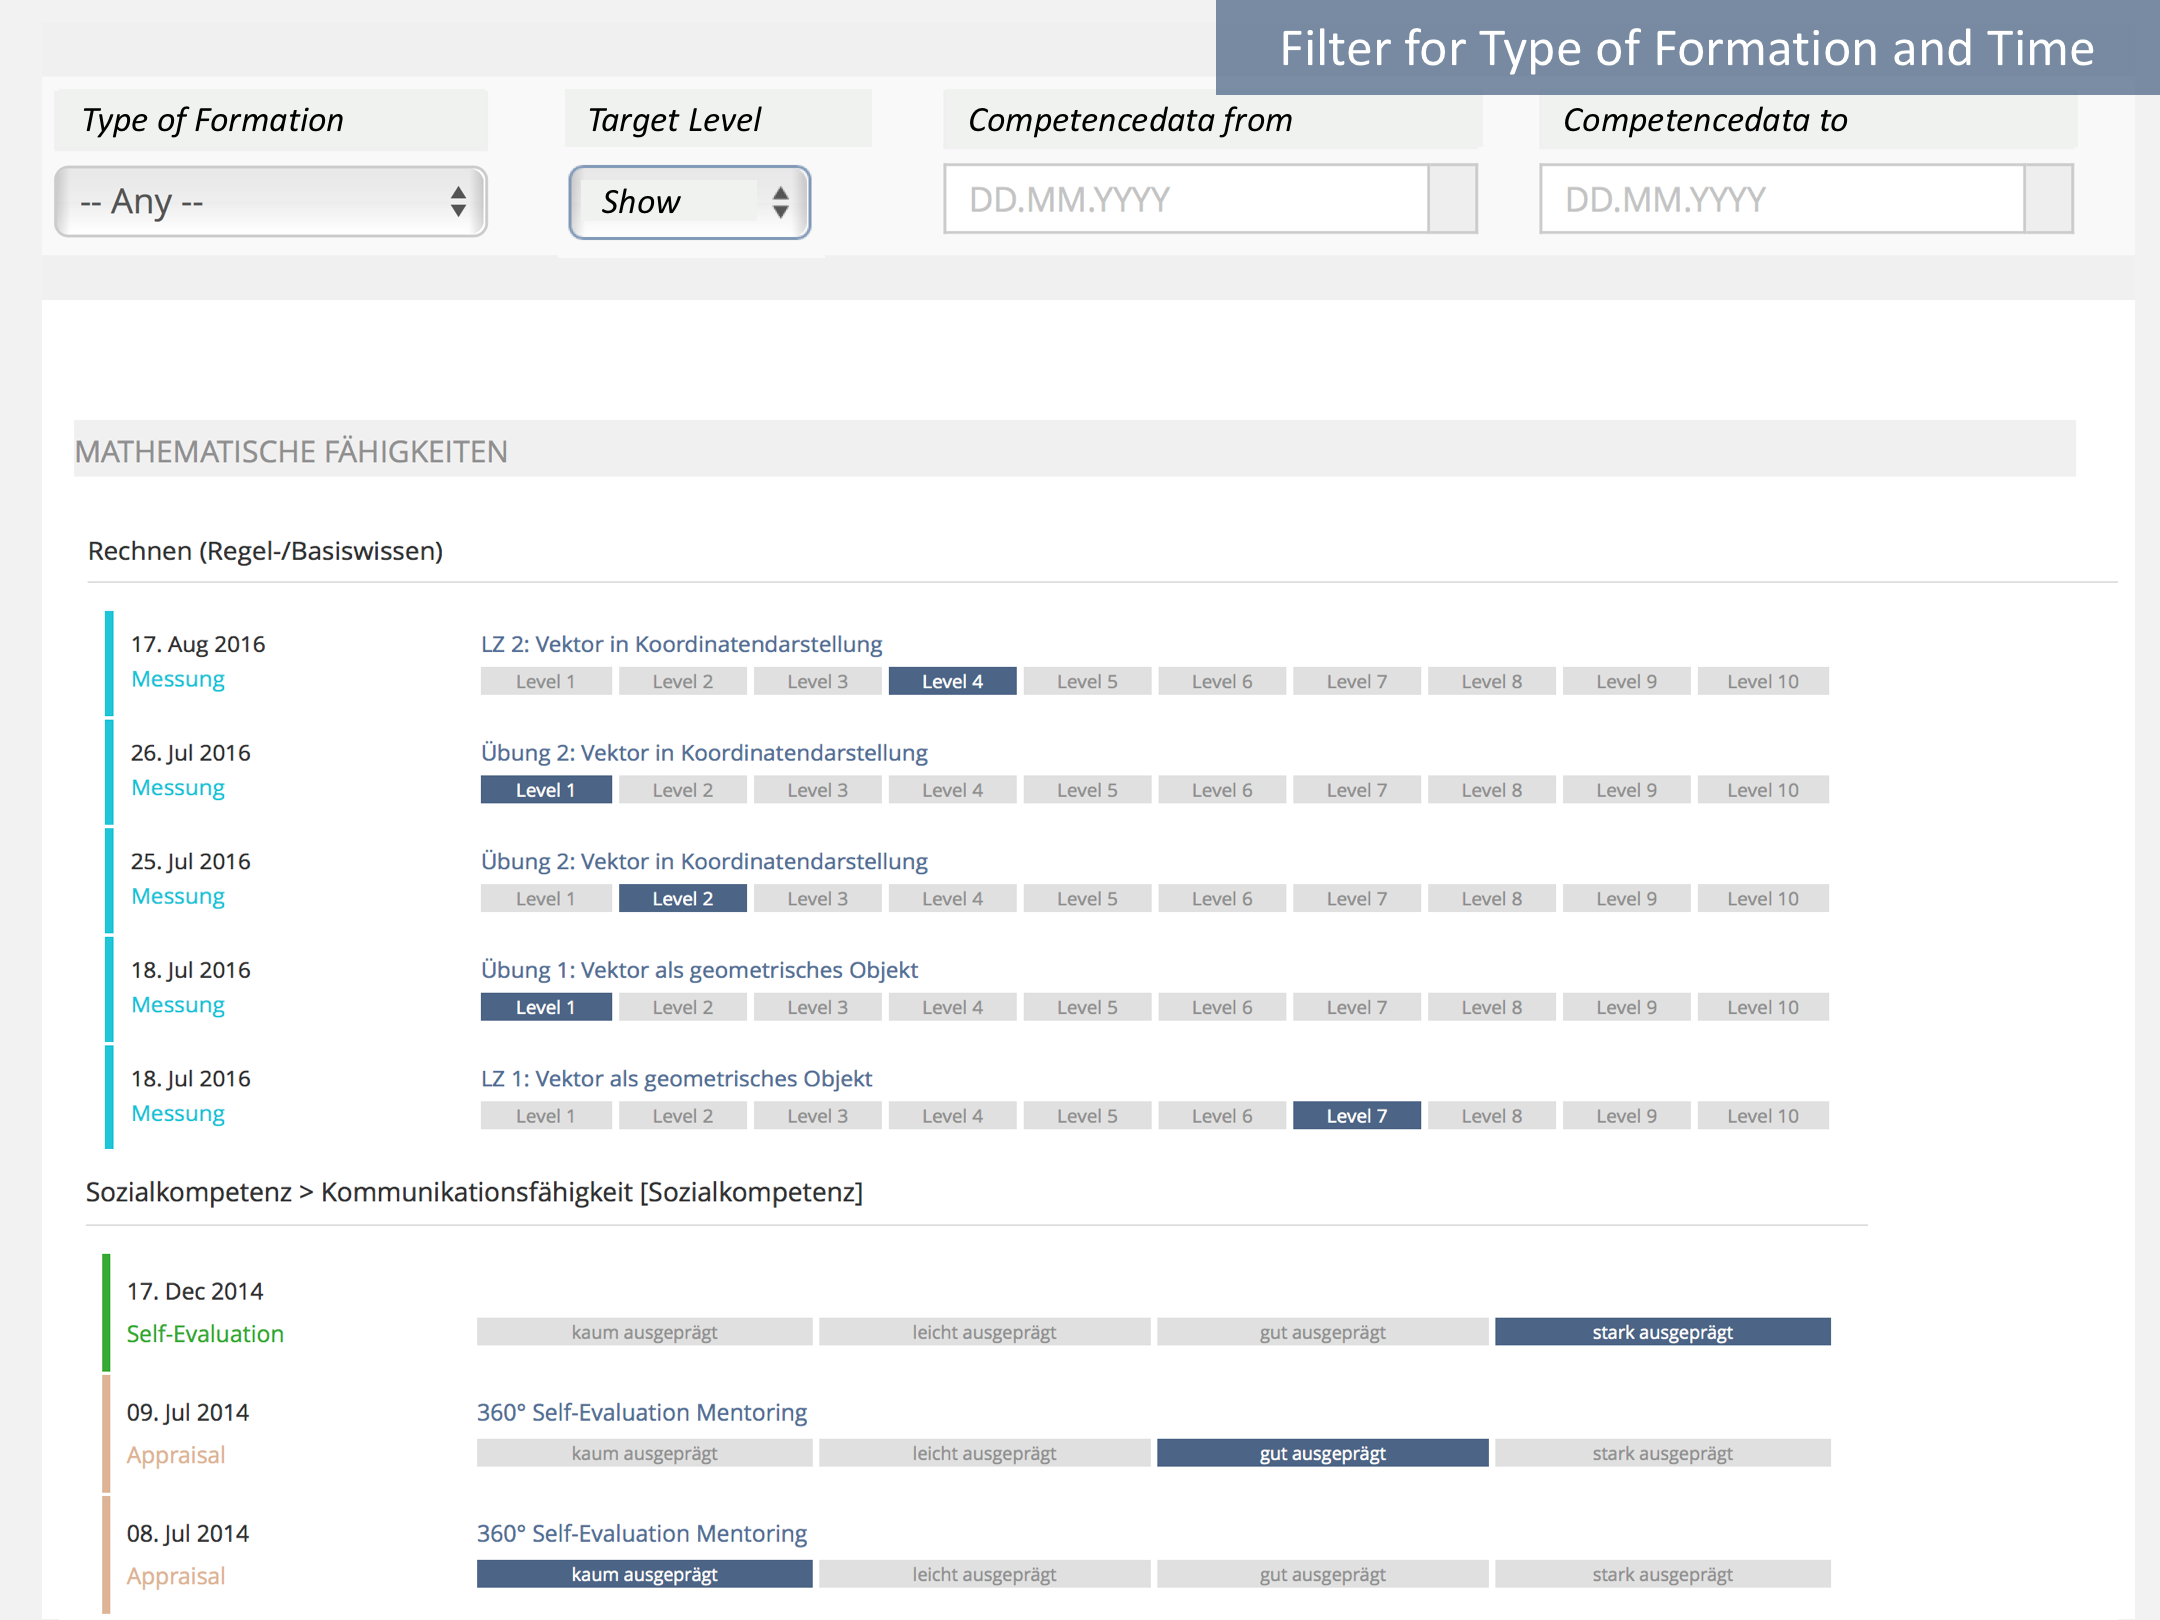
- Competence records are available from different points in time. Which ones of these competence records are included in computing the average? All records from the last 60 days, 180 days, all ever, 2 years?
Caveat: This cannot be implemented unless the questions concerning computation method are answered.
3 User Interface Modifications
3.1 List of Affected Views
- Personal Desktop > My Competences
3.2 User Interface Details
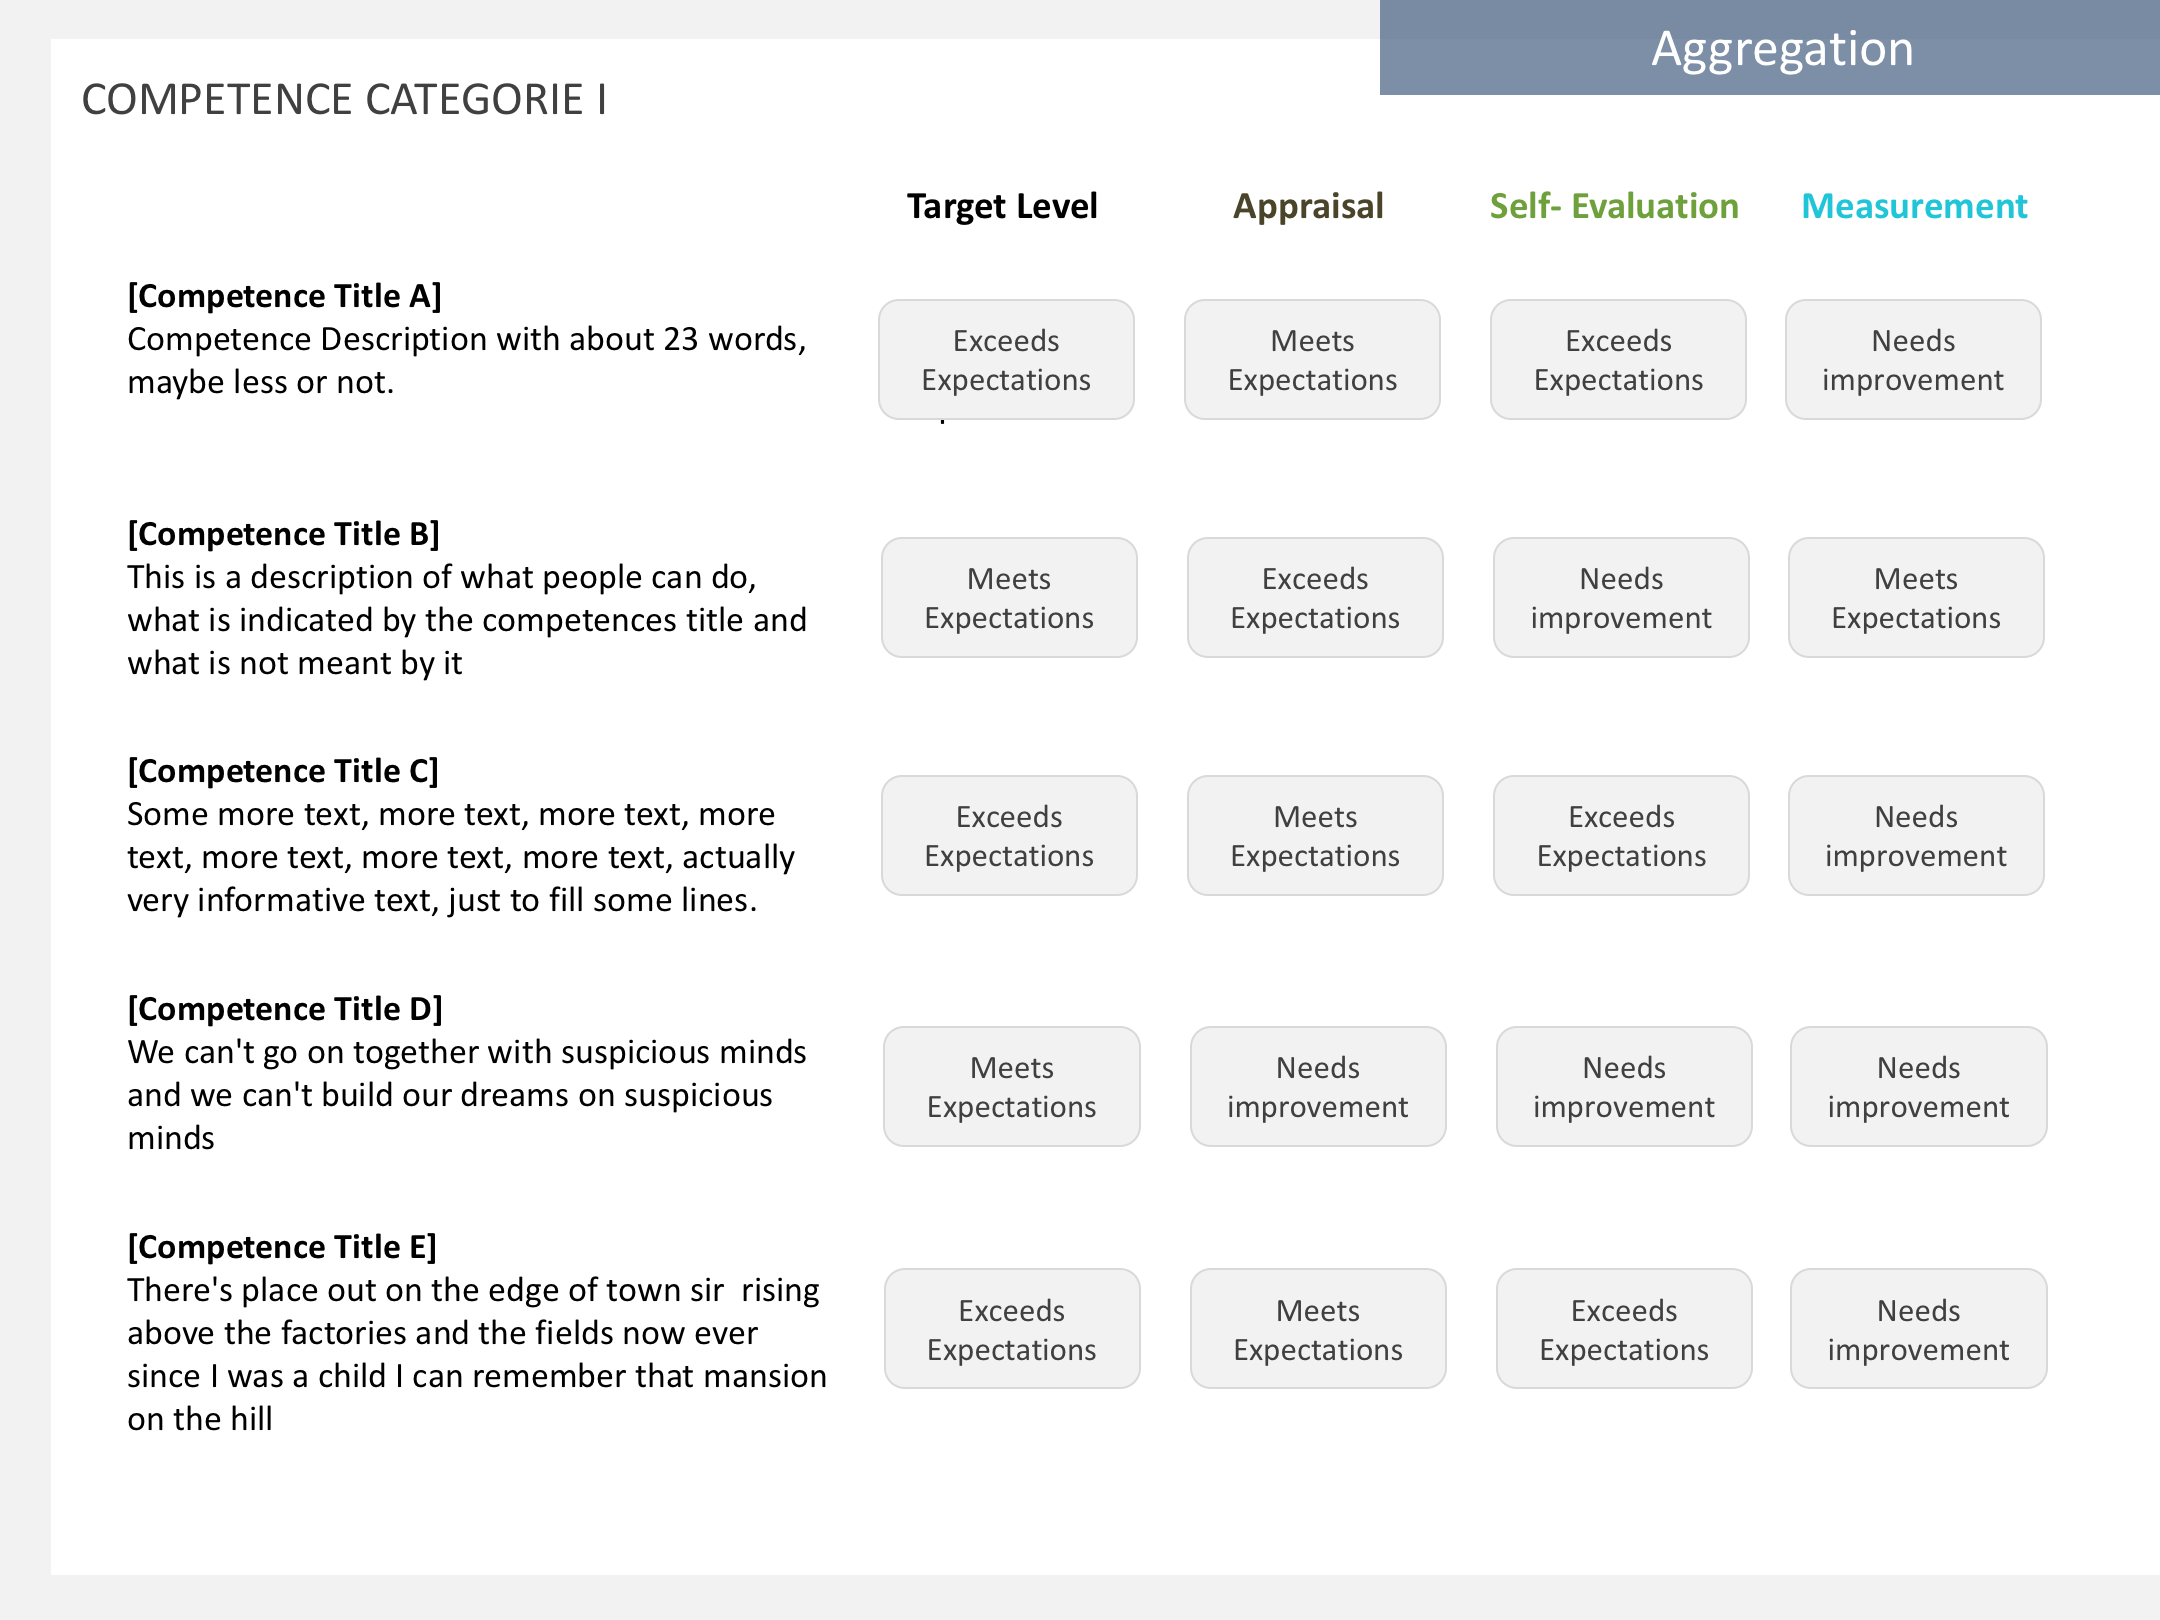
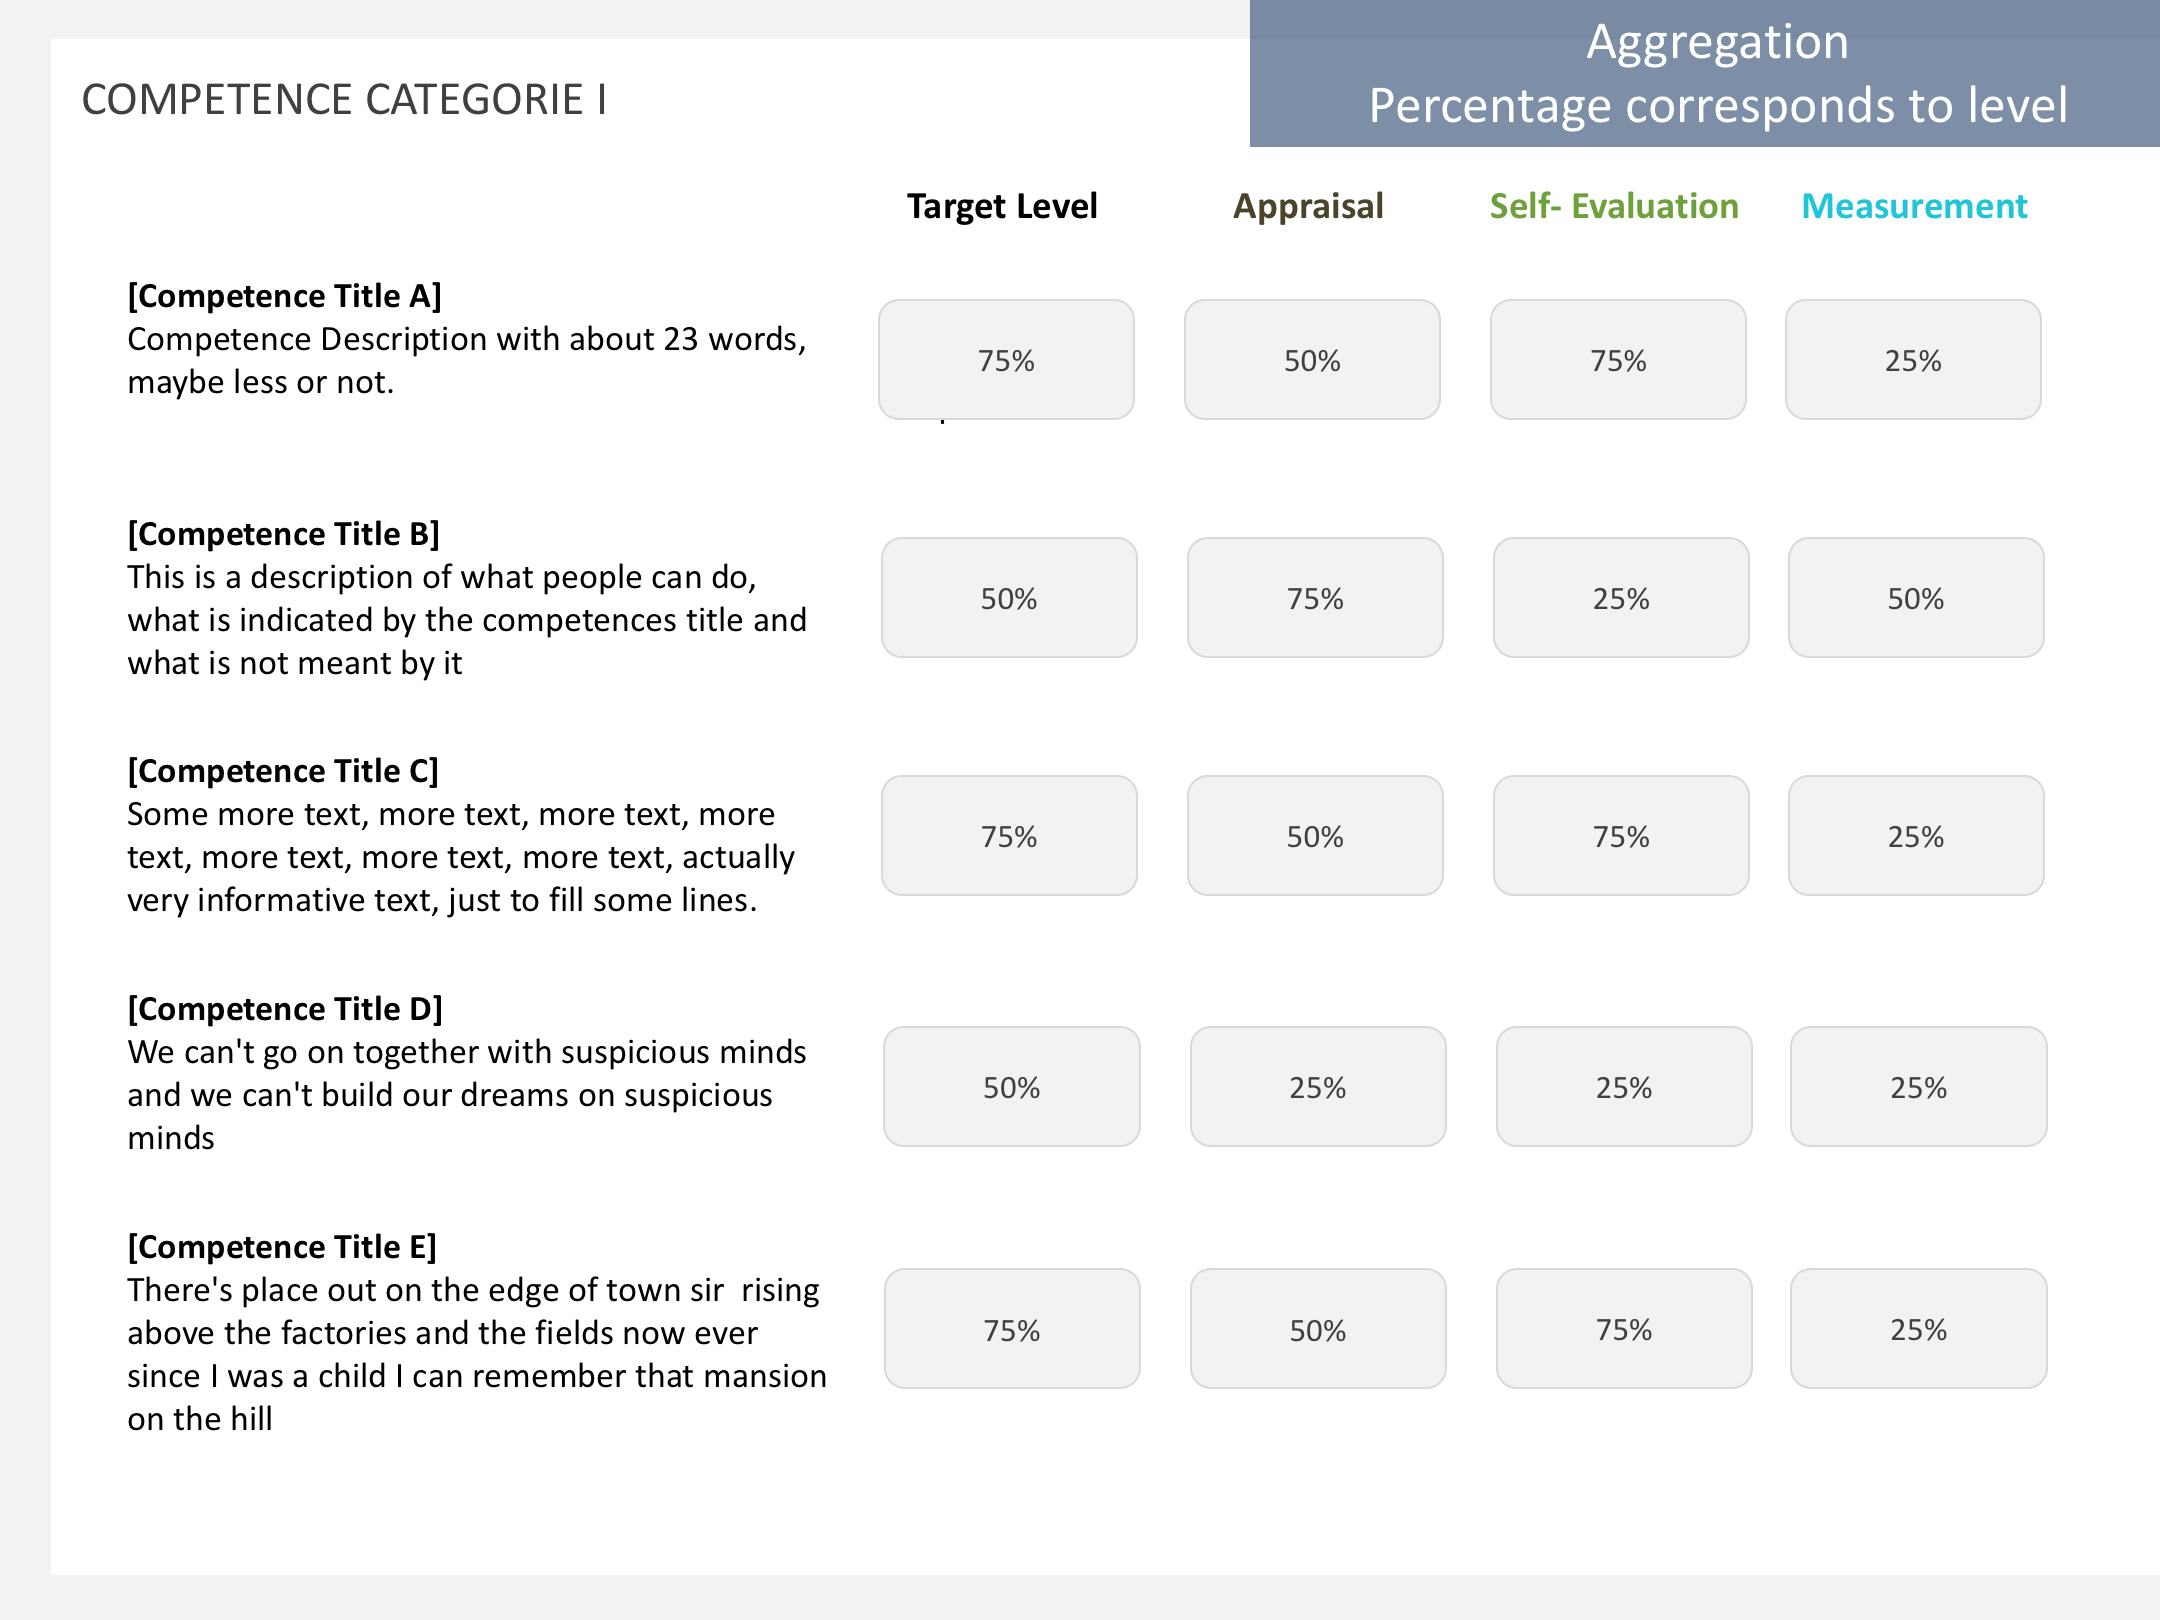
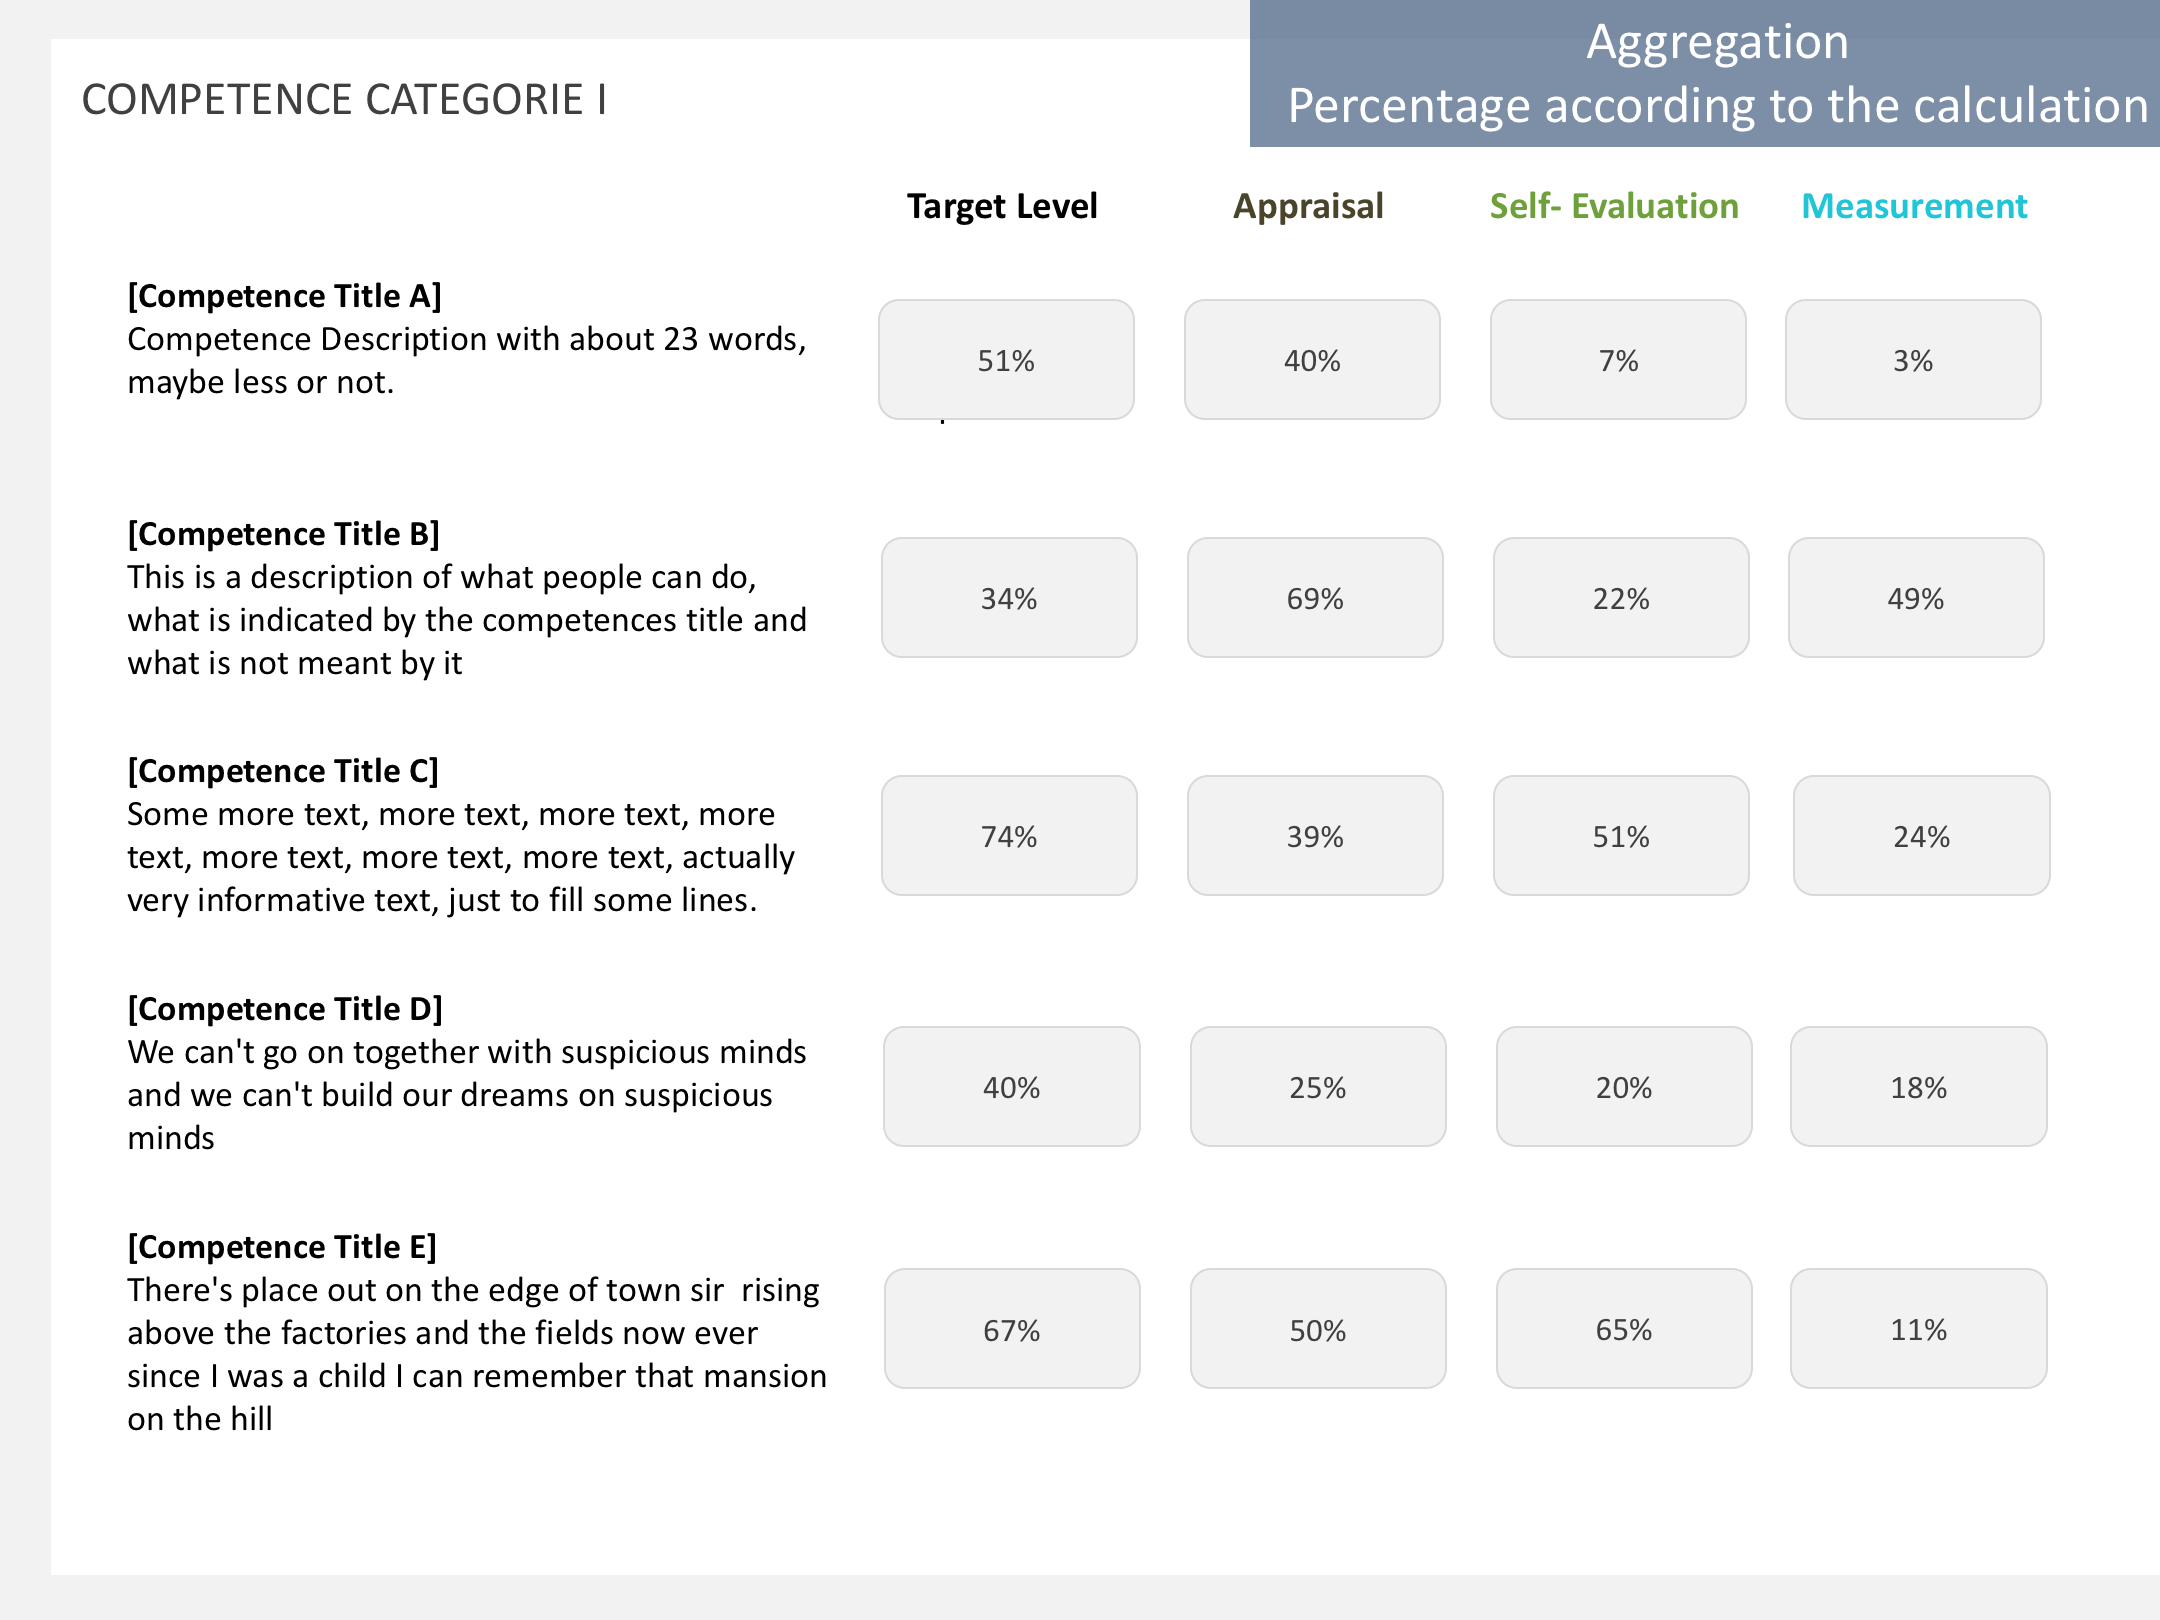
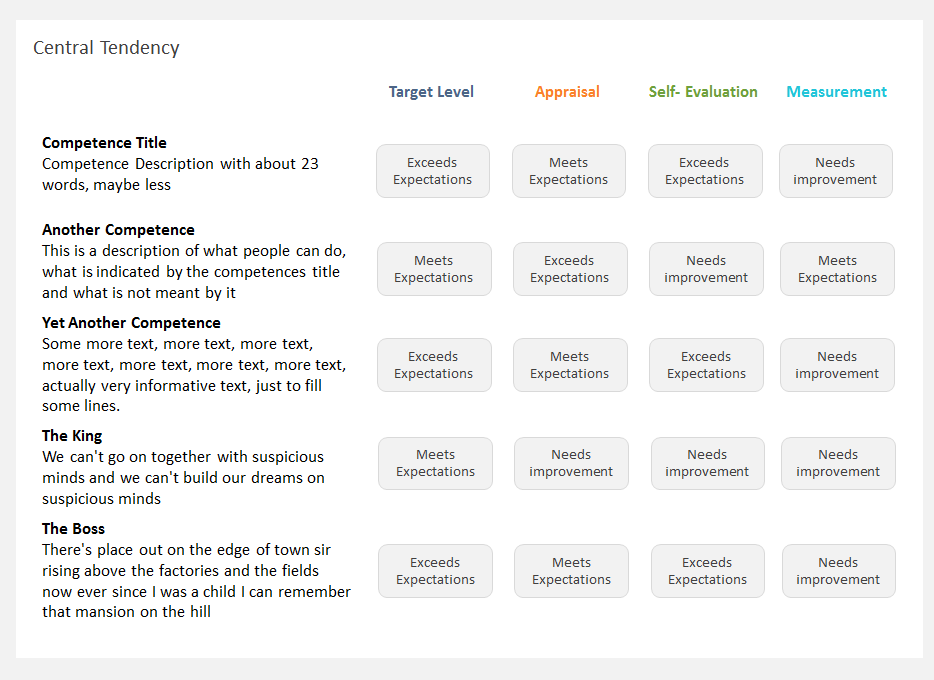
- Headline of the Reporting Panel is generic: Central Tendency
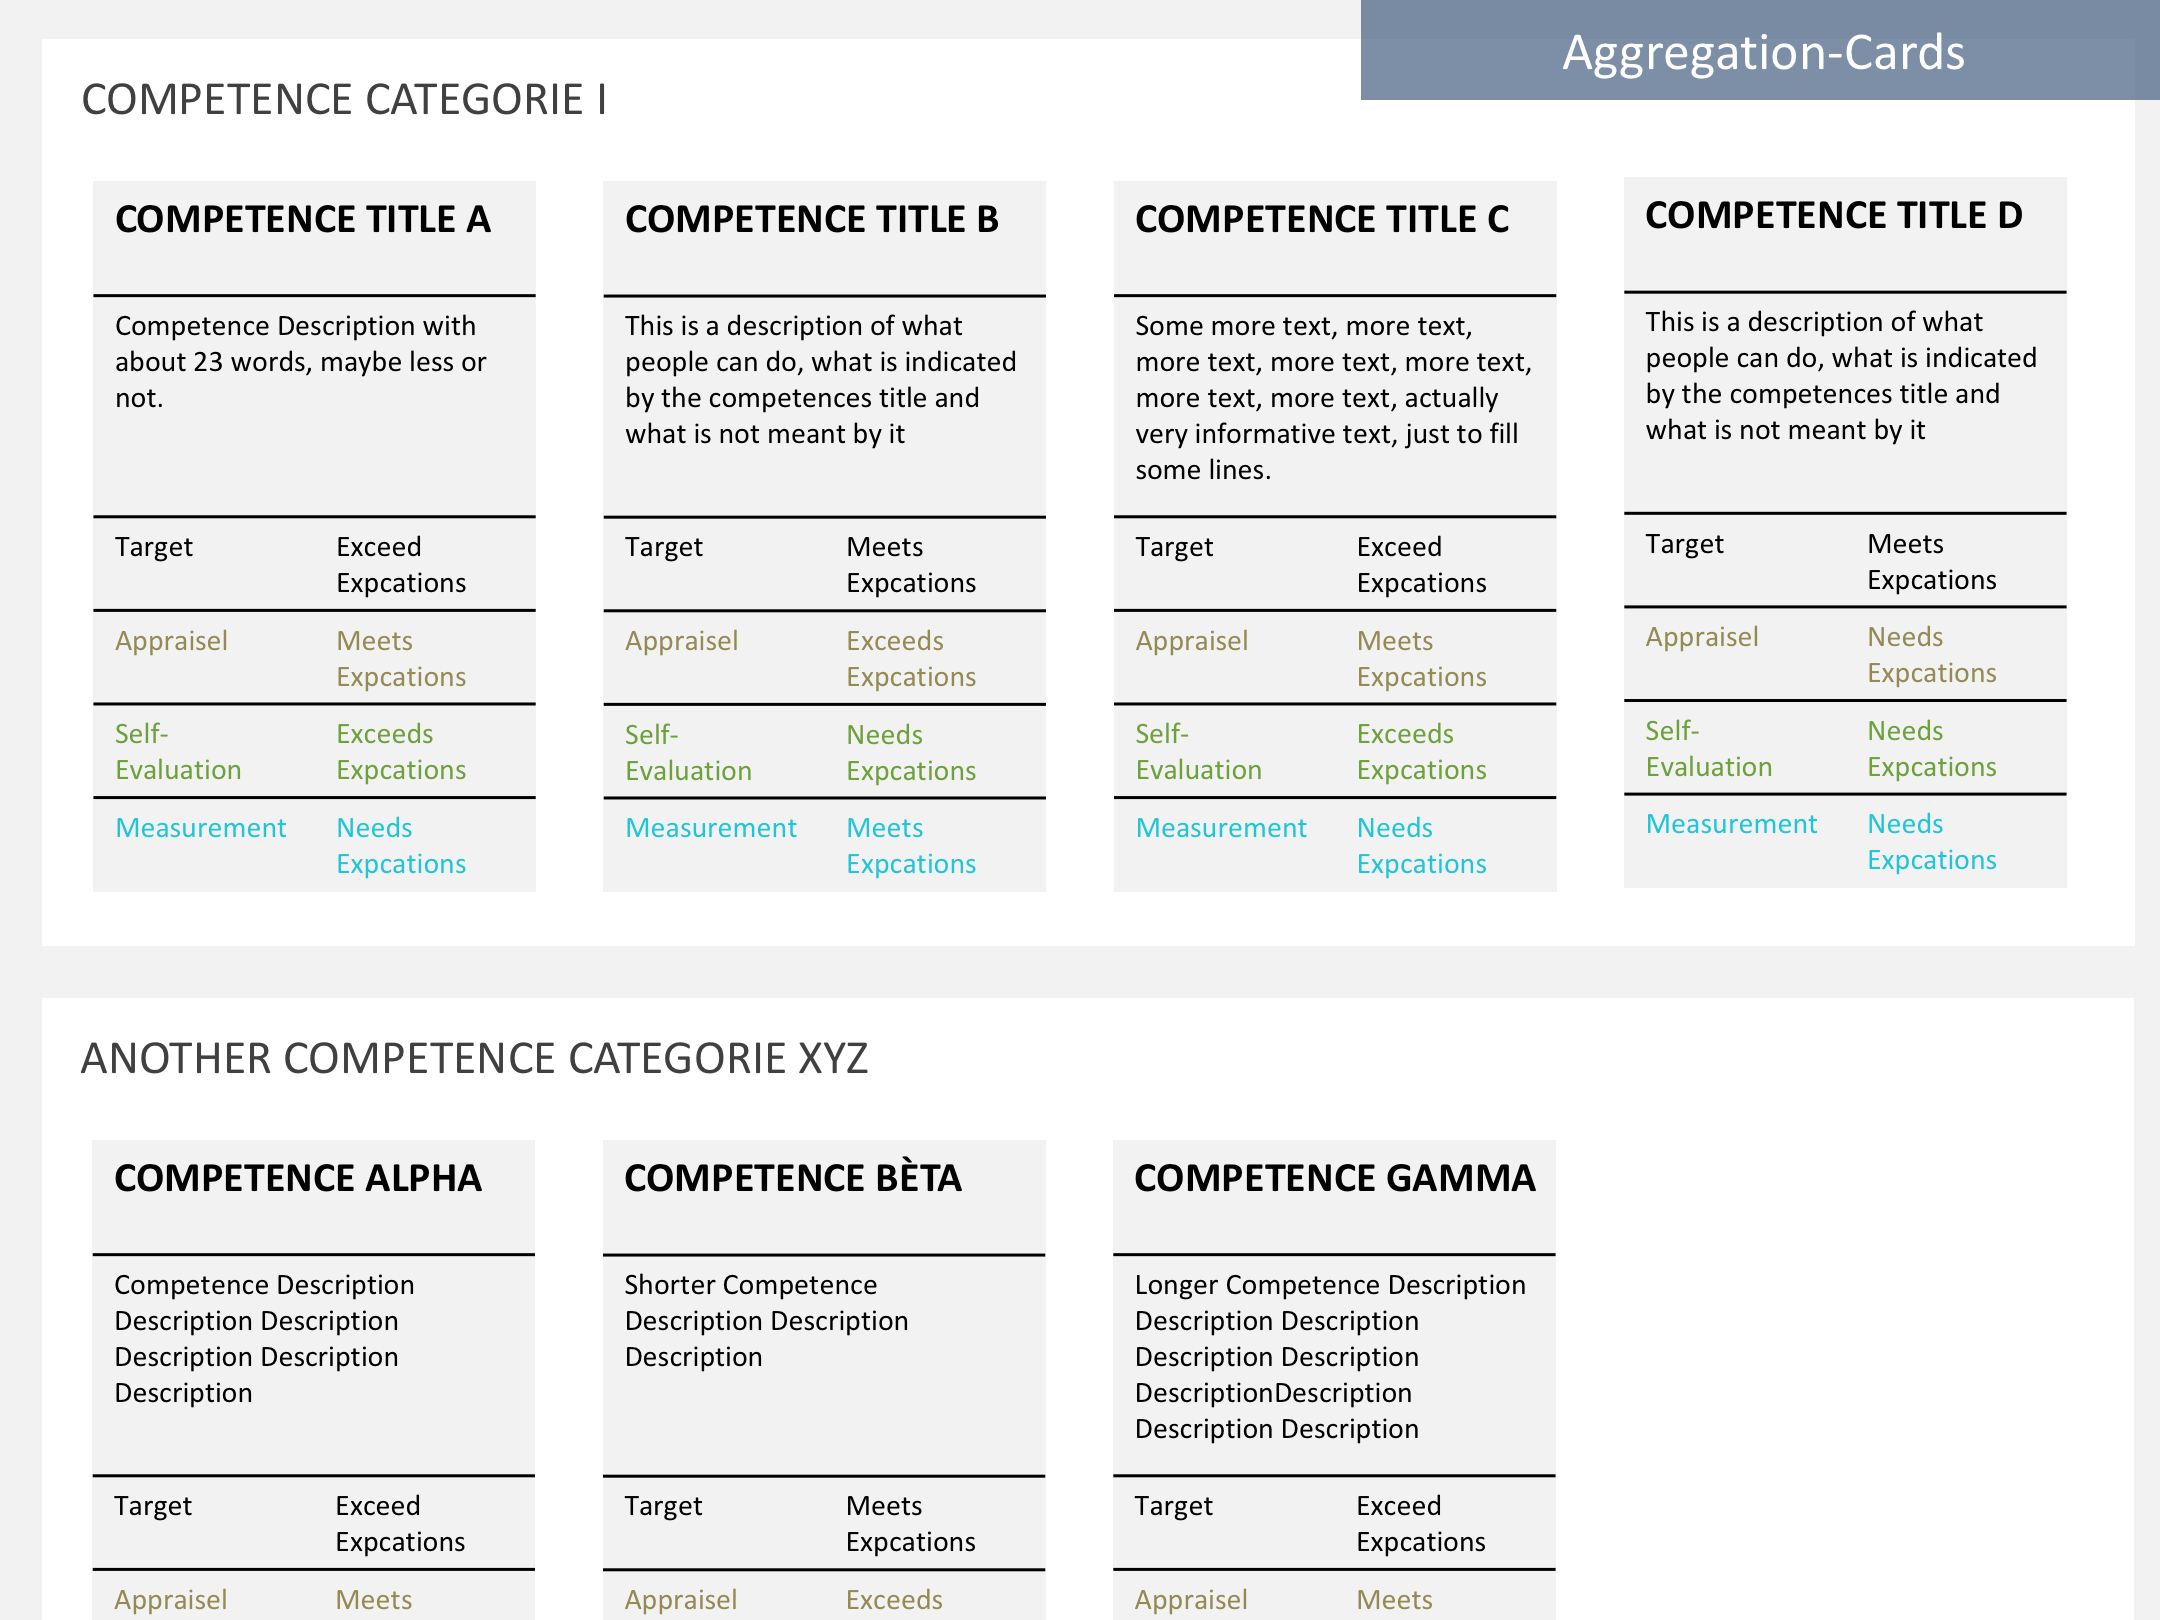
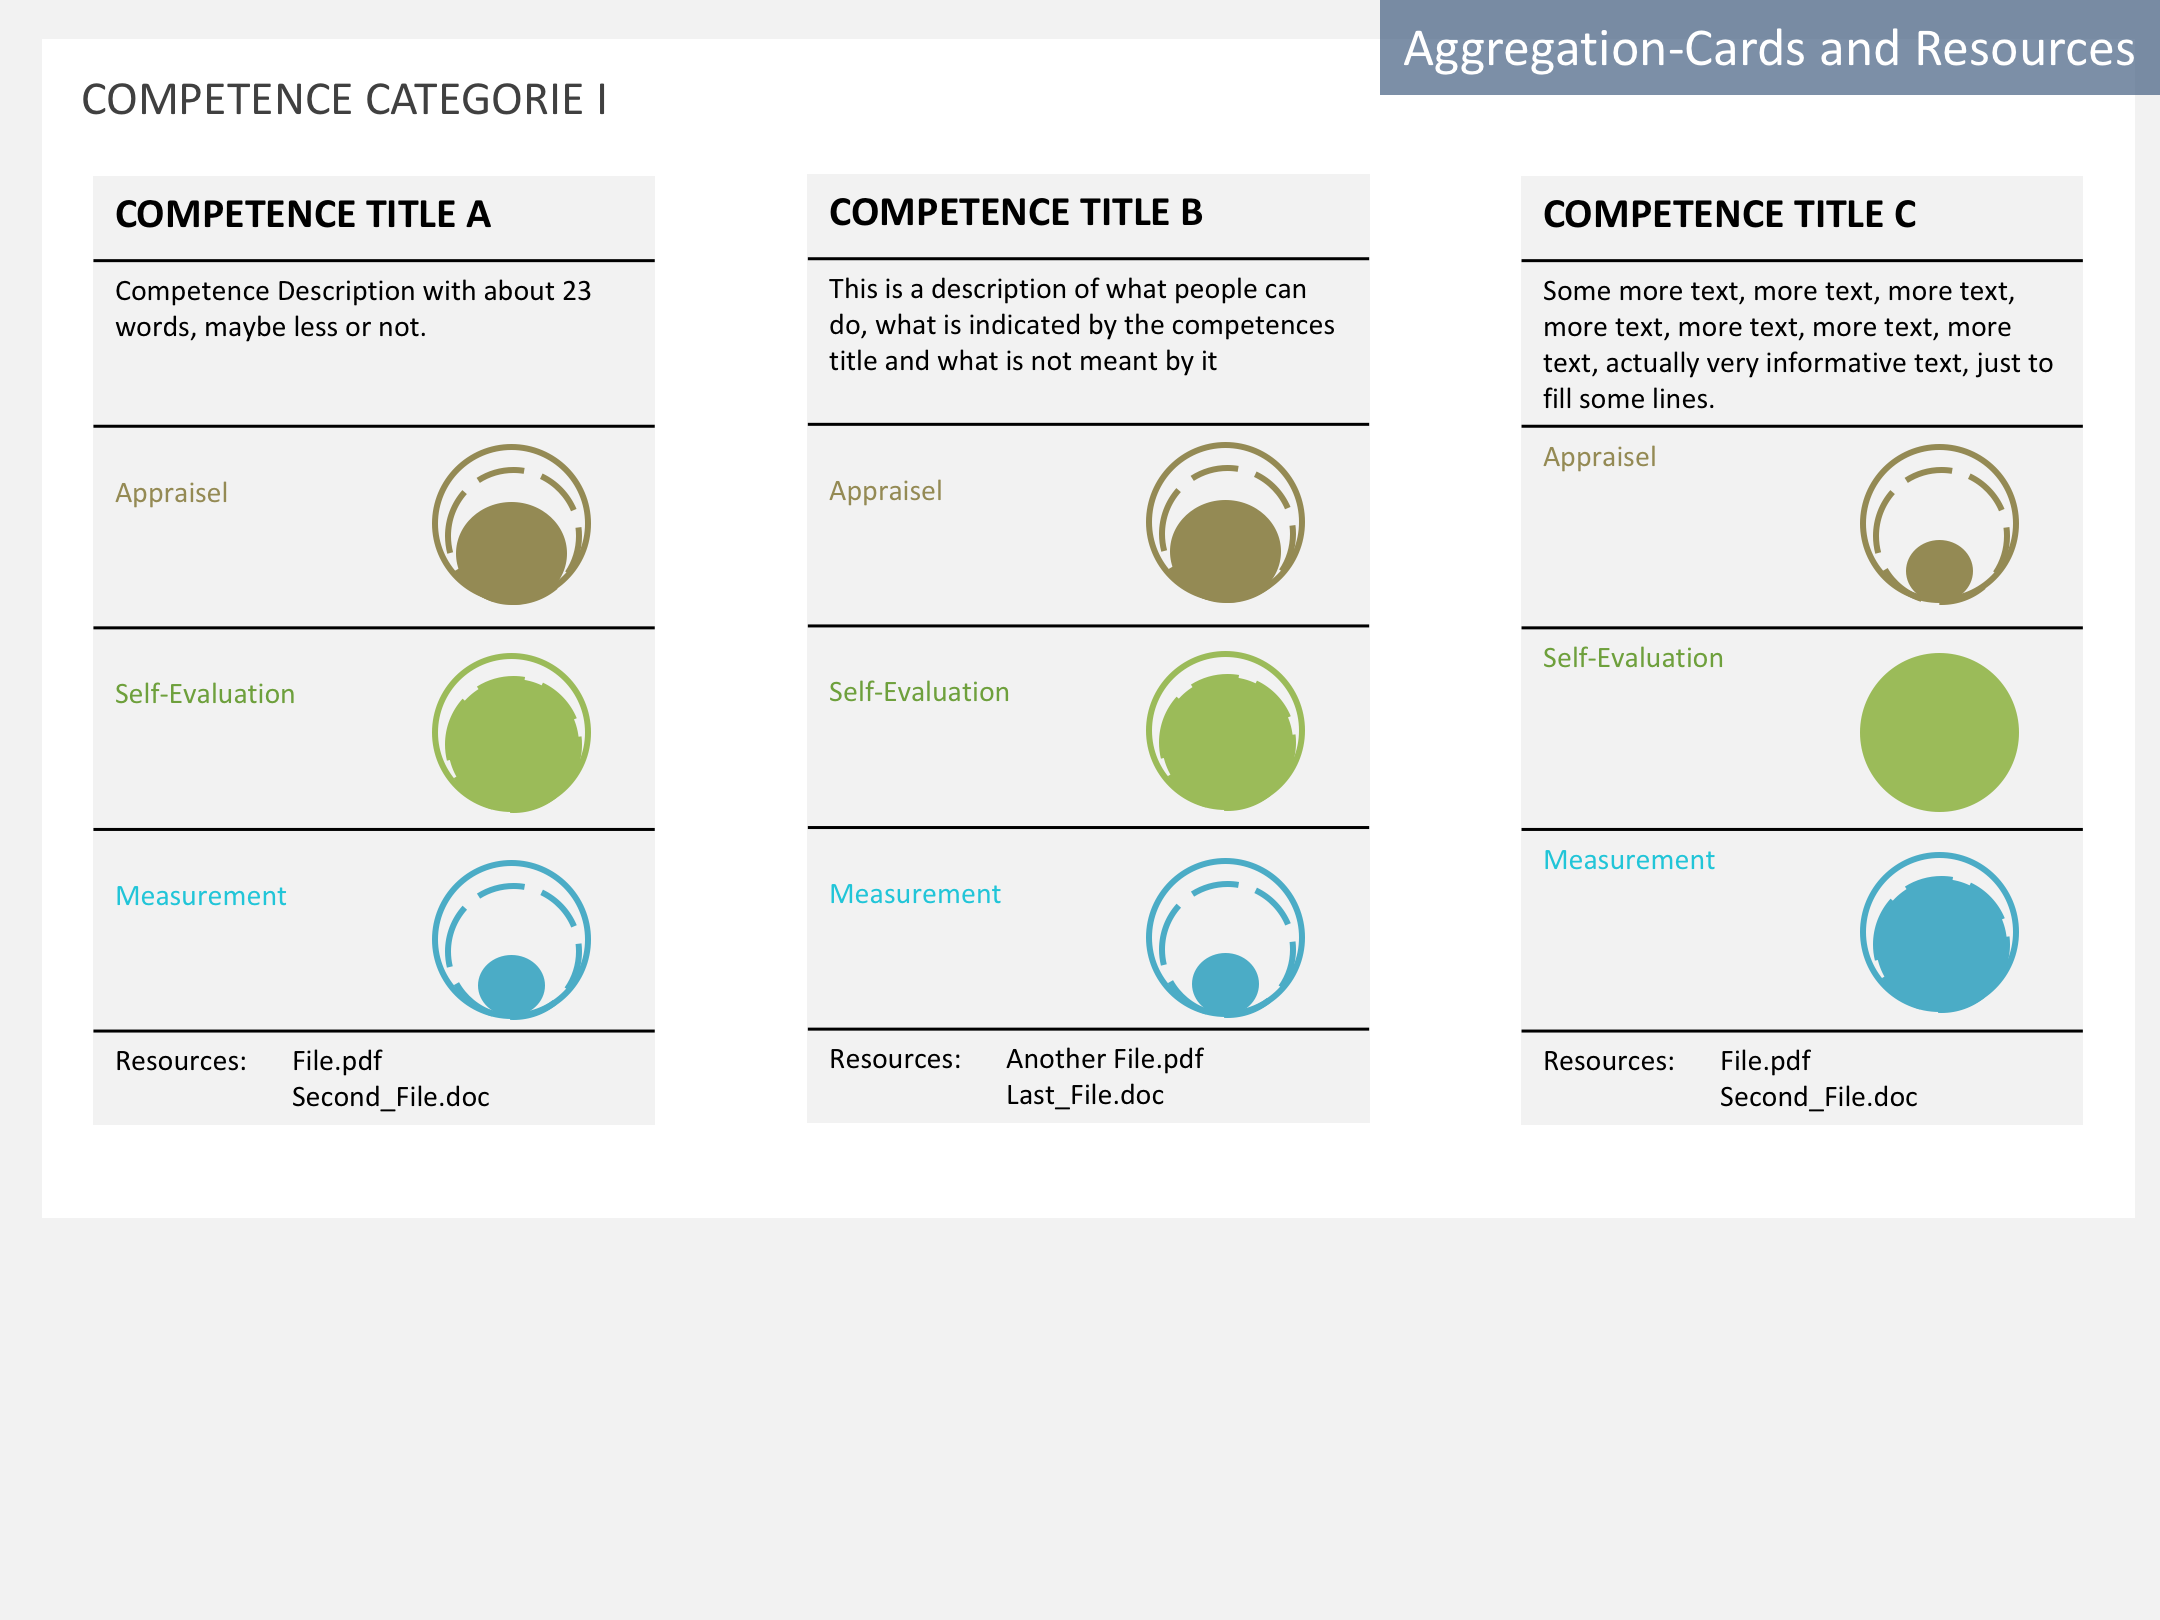
- The Reporting panel with sub-panel is used: Datagrid sub-panel for displaying central tendencies per competence and formation type:
- Taget level, range is not indicated
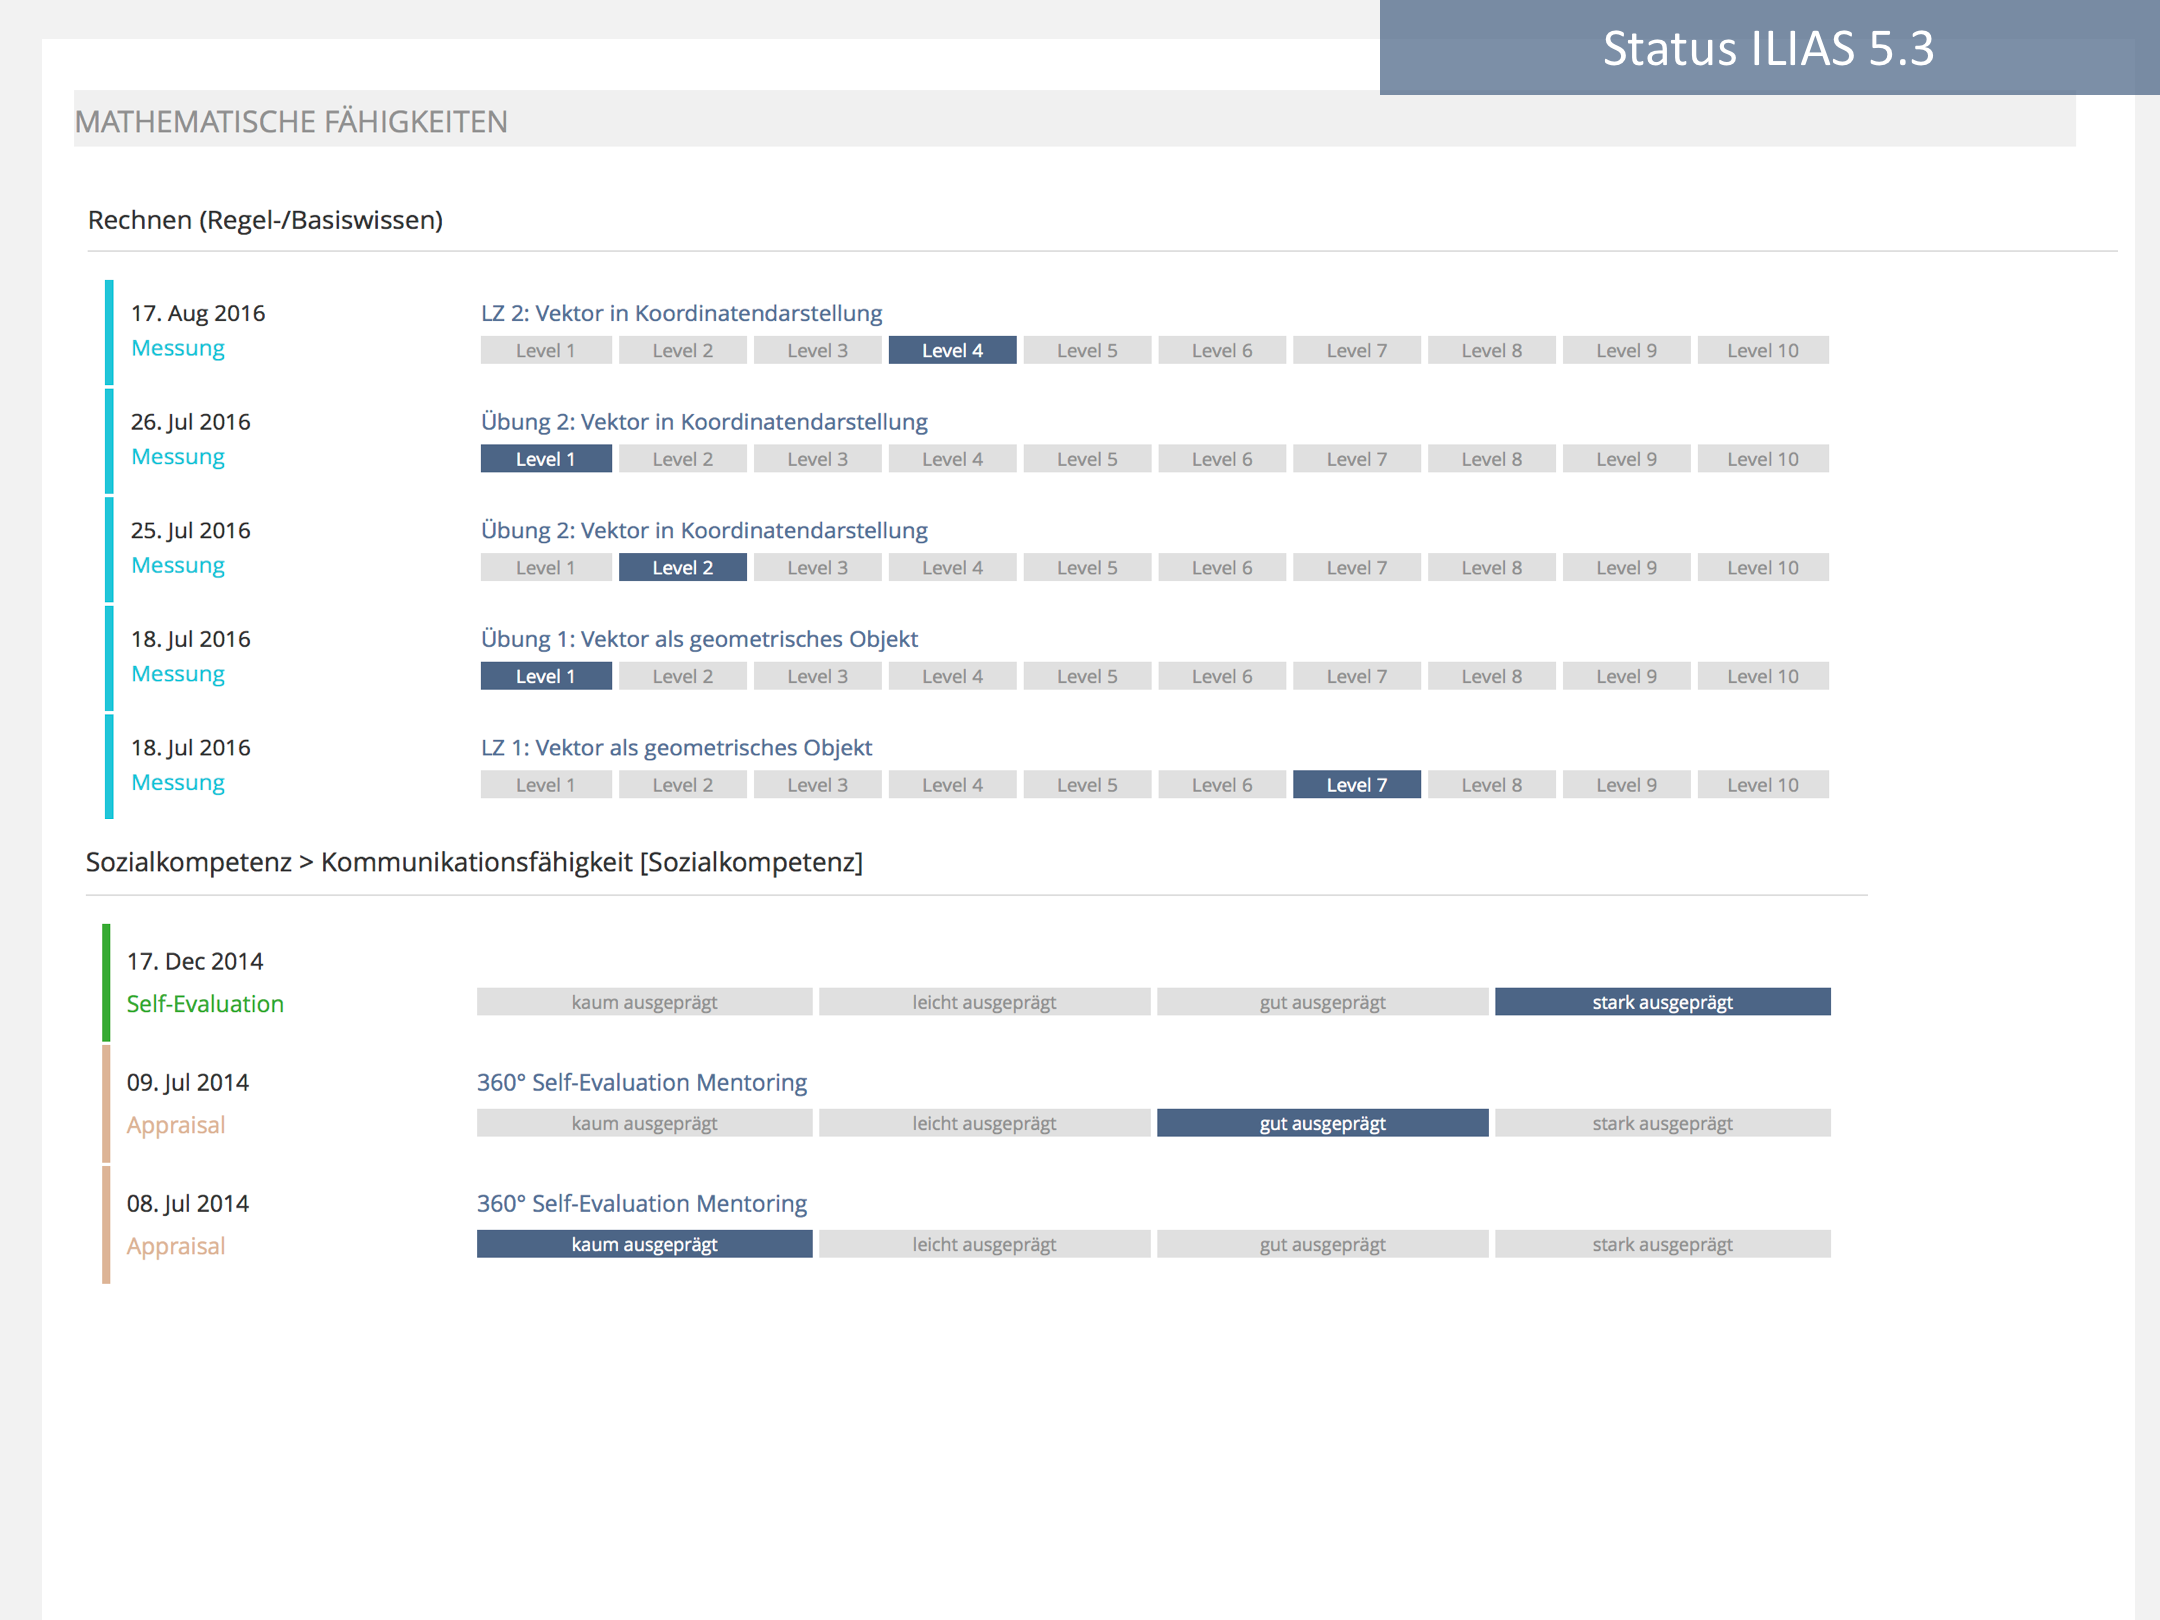
- Self-Evaluation
- Appraisal
- Measurement

3.3 New User Interface Concepts
This project uses the KS Reporting Panel
4 Technical Information
{The maintainer has to provide necessary technical information, e.g. dependencies on other ILIAS components, necessary modifications in general services/architecture, potential security or performance issues.}
5 Contact
- Author of the Request: {Please add your name.}
- Maintainer: {Please add your name before applying for an initial workshop or a Jour Fixe meeting.}
- Implementation of the feature is done by: {The maintainer must add the name of the implementing developer.}
6 Funding
- ...
7 Discussion
Kiegel, Colin [kiegel] 2016-12-01 How would these reports look on mobile devices? IMO it would be desirable to have a one-column representation for small devices. Of course table-features like column based sorting would either not be available or would have to be implemented differently in a second step.
The more general question is: Are there any plans to introduce a UI element which is "one column" on a smartphone and "multi column" on desktop? I think we should try to avoid using traditional tables for new features as much as possible due to their bad properties on mobile devices.
Suittenpointner, Florian [suittenpointner], October 10, 2017:
I see another open question that doesn't occur above because all of the examples are related to tests. However, also 360° feedback surveys can produce competence records ...
The problem: In Surveys, you usually have data on ordinal scale level, i.e., the different answers only differ by rank. Answers like "very good", "good", medium" a.s.o. cannot be considered to have exactly the same distances from each other (which would be metric scale level). So, strictly speaking, computing averages from such data is scientifically not allowed. In practice, scientists conduct so-called pre-tests on people's perception of distances between answers, in order to make sure, answers are perceived equidistant and, thus, to achieve a so-called quasi-metric scale level.
This is why ILIAS doesn't compute an arithmetic mean from single choice questions in surveys but only from metric question.
However, in the making of the 360° feedback (that is computing averages already today), this problem has been ignored. The question is now whether we want to perpetuate this problem or find a better solution and also use it on the existing 360° feedback survey.
8 Implementation
{The maintainer has to give a description of the final implementation and add screenshots if possible.}
Test Cases
- {Test case number linked to Testrail} : {test case title}
Approval
Approved at {date} by {user}.
Last edited: 17. Nov 2017, 11:23, Tödt, Alexandra [atoedt]
