Feature Wiki
Tabs
Competence Management - presentation of competence results
Page Overview
[Hide]1 Initial Problem
- in the Administration for editing (tables and forms)
- My Competences on the Personal Desktop for selfevaluation ("spreadsheets" and forms)
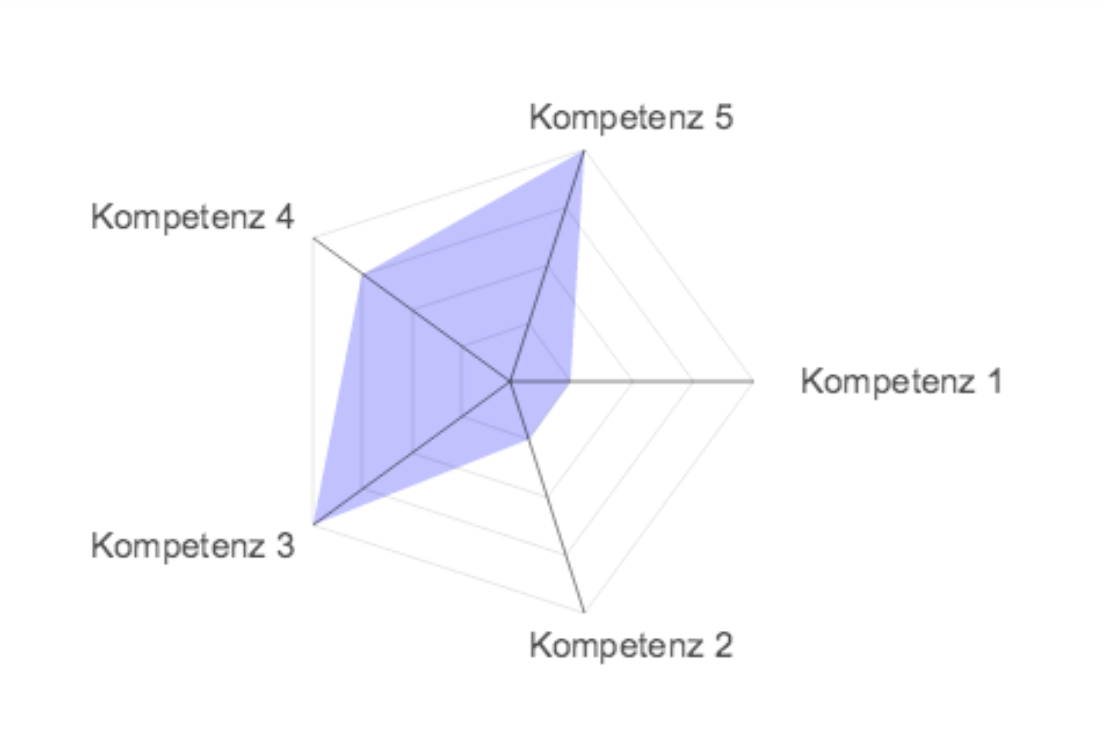
- in the Results-tab of a 360° Feedback survey ( spiderwebs and "spreadsheets")
- after the test in the test (spiderwebs and "spreadsheets")
- the presentation is not very attractive
- the amount of information provided might make it hard to identify what is most relevant
- on the Personal Desktop important information is buried in tool tips
- presentation of competences varies greatly from object to object / location to location (spiderweb only in survey but not in test for turors, not on personal desktop, not stamped in portfolio)
- users have little indication what to do next with the information (exemption: gap analysis in survey)


Object / Location | "Spreadsheets" | Spiderweb | optes SkillUI |
Personal Desktop in My Competences | yes | no | yes |
Stamped in Portfolio | yes | no | yes |
360°-Survey displayed to users | yes | yes | no |
360°-Survey displayed to tutors | yes | yes | no |
Test&Assessment displayed to users | yes | yes | no |
Test&Assessment displayed to tutors | no | no | no |
Actual Scenario of Optes Project
Competence information is used by two different stakeholders:
Users
Users access competence information in the portfolio and My Competences on the Personal Desktop.
Competence information serves as a basis and trigger of reflection on potential and shortcomings in math.
Tests are employed to measure competence; competence information is visualized using the bubble plug-in. 360°-Surveys are employed to self-evaluate competences; competence information is visualized using spiderwebs.
Mentors
Mentors specialise in supporting learning processes, they do not neccessarily specialise in the subject matter at hand.
Mentors help users to engage in reflecting their own learning process and evaluating their own progress. They rely on the competence information provided via the users portfolios.
Mentors rely on literally all aspaects of the competence information provided: competences, levels, required levels, source of measurement, time of measurement, self-evaluation or peer-evaluation. Only profiles are not used yet.
Planned Scenario for Law Enforcement Training at UA of Public Administration Northrhine Westfalia
In this scenario we whould like to implement the competence-goals of the module description.
We know that this is a very ambitious goal, but in our opinion, this is necessary to get an added value.
but with these huge amount of competences, it is necessary to visualize the competences.
The student
The student should get a very quick overview of the competences he is going to get. He should also see very quickly, which special competences are the most important for his or her goals.
So I think it would be very useful, if the student get a preset (or manageable) profile of selected competences. This competences could be visualized with spiderwebs.
The teacher
"How I have to teach, that they reach these competence-goals"
Who needs more help?
Visualization: Sorting the competence-bubbles.
The training manager
To get a quick overview. To improve the transparency between FHöV / LAFP / PP.
Inventory
- Kommentar: We feel the "fever curve" is arbitrary. a) The line between the dots are totally meaningless but very prominent. b) Its look depends entirely on the order of the individual competences
- Kommentar: siehe oben
Competence Wheel
außerdem siehe Seite 5 unter http://www.portfolio-kompetenzmanagement.ch/myUploadData%5Cfiles%5CTagung08_REF_NORTH.pdf), http://www.kompetenzmanager.ch/beispiel_auswertung_kompetenzrad.cfm
- Kommentar:
- We need a proper solution for the legend. Users need to be able to relate the area with the title of a competence.
- We would like to forego the need to edit a color set. We suggest to use only one color for the competence area and one different color for the profile color.
- We would like to replace the spider web with this kind of chart.
2 Basic concepts of competence visualisation and justified constraints
- Self-evaluation: a user states his or her own comeptence level on Personal Desktop or in 360° Survey (implemented)
- Appraisal by others: a user states the competence level of another user in 360° Survey (implemented) or tutors in course (suggested feature for 5.2)
- Meassurement by object: An object measures and sets competence level in test (implemented)
- Target-Setting: a profile defines the required level
- Time (Date vs. History)
- Formation (Self-Evaluation, Appraisal, Measurement)
- Data (Min, Is, Should, Max)
- Scope (one competence vs. selection of competences vs. horizon of profiles)
- Any colors set must stand aloof from the traffic-light metaphor.
- If bubbles are used, all bubbles should be of one color or several coulour of a fxied non-traffic-lightish set
- The types of formation should be color-coded. One fixed color for each type of formation: self-evaluation, appraisal, measurement, target comeptence.
- We oppose any feature that would require a dedicated color-pallette editor anywhere but in the administration.
3 Suggested Visualization
We require the presentation to be attractive, clear (identifiable most important message), capacitating (advising next steps to be taken). We require the presentation of competence record to be as uniformly as possible across objects / locations. Option to configure the presentation of competence records would be welcome.
Required Data for Visualisations We require all visualisations to afford displaying the following data points in some way:
|
4 Sub-Projects
- Competence Reporting Panels: only one Competence is displayed in depth showing historical data
- Introduction of bar charts: Set of Competences for one single point in time from one source object
- Aggregation Reporting Panels: Horzion of Comeptences for a study programme that could be contrasted with IS-data (plan for future, does not yet exist)
Last edited: 21. Dec 2020, 13:38, Zenzen, Enrico [ezenzen]